Introduction
In this blog post I will demonstrate how to load Qualtrics Survey Data via a custom SAP Data Intelligence operator into a SAP HANA Cloud table for use in SAP Data Warehouse Cloud and SAP Analytics Cloud. I will show how solutions from unified data and analytics can be used together to get insights from a Qualtrics Survey by going step by step over how to integrate Qualtrics in them creating an End-To-End-Story.
This demo is split in the following parts:
Part 1: Creating a survey in Qualtrics that you can publish to gain valuable insights into customer opinions about a topic you are interested in
Part 2: Loading the survey data into a SAP HANA Cloud Table by creating and using a custom python operator in SAP Data Intelligence
Part 3: Modelling the data in SAP Data Warehouse Cloud and creating an Analytical Dataset
Part 4: Visualizing the Data by creating a Story in SAP Analytics Cloud
Part 1: Creating a Survey in Qualtrics and Gathering Responses
To start of it is necessary to have a Qualtrics Survey you want to gain insights from. In this demo I will create a small survey concerning customer satisfaction for a random product.
In Qualtrics I start by creating a new project and use the question types Multiple Choice, Text Entry, Net Promoter Score and Sliders since those are easier to visualize in SAP Analytics Cloud later than some of the other question types.
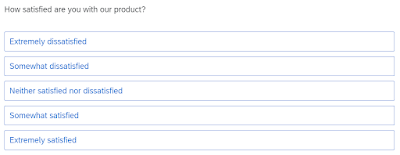
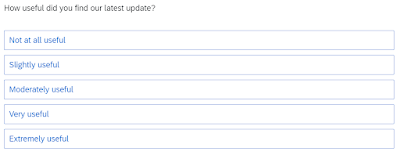
In the following images you can see a preview of the Qualtrics survey that I am going to use in this demo.
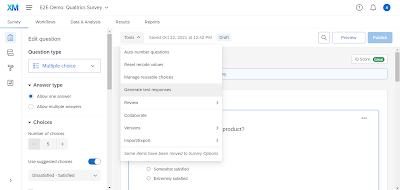
After finishing the survey I use one of Qualtrics features to create test responses. You can access it by choosing the option “Generate test responses” in “Tools” in the edit view of your survey.
Here you can choose how many test responses you want Qualtrics to generate for you if you are creating a survey for test purposes. Outside of a testing scenario you would of course publish the survey via Qualtrics to gather responses from participants.
Before we go to the next step it is crucial to first gather some information about the survey. In the account settings of your Qualtrics profile there is a tab called “Qualtrics IDs” which contains the Survey IDs of all your created surveys as well as their Datacenter ID and your current API Token.
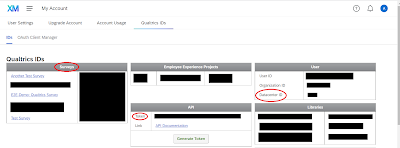
All three of those IDs/Tokens concerning your survey are needed to later access your survey data through the Qualtrics API.
Part 2: Loading the Survey Data into a SAP HANA Table Using SAP Data Intelligence
Now that you have a survey you can use SAP Data Intelligence to load it into SAP HANA.
In SAP Data Intelligence I start by creating a new Operator in the modeler with the Python3-operator as its base. I define the following input- and output ports:
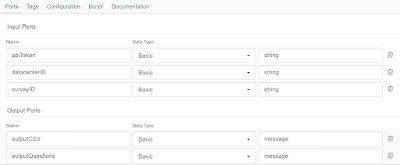
The output is split in two different csv files with one containing the actual data and responses from the accessed survey and the other the full questions/text of the survey in case you need that information later on in the process (for example if you do not have access to the survey anymore).
For the script I use a slightly changed version of the code provided on Qualtrics documentation page “
Getting Survey Responses Using New Export APIs” that I edited to fit into the SAP Data Intelligence environment and to create the two desired outputs.
import requests
import zipfile
import json
import io, os
from io import StringIO
import sys
import re
import pandas as pd
def exportSurvey(apiToken,surveyId, dataCenter, fileFormat):
#Setting static parameters
requestCheckProgress = 0.0
progressStatus = "inProgress"
baseUrl = "https://{0}.qualtrics.com/API/v3/surveys/{1}/export-responses/".format(dataCenter, surveyId)
headers = {
"content-type": "application/json",
"x-api-token": apiToken,
}
#Step 1: Creating Data Export
downloadRequestUrl = baseUrl
downloadRequestPayload = '{"format":"' + fileFormat + '"}'
downloadRequestResponse = requests.request("POST", downloadRequestUrl, data=downloadRequestPayload, headers=headers)
progressId = downloadRequestResponse.json()["result"]["progressId"]
print(downloadRequestResponse.text)
#Step 2: Checking on Data Export Progress and waiting until export is ready
while progressStatus != "complete" and progressStatus != "failed":
print ("progressStatus=", progressStatus)
requestCheckUrl = baseUrl + progressId
requestCheckResponse = requests.request("GET", requestCheckUrl, headers=headers)
requestCheckProgress = requestCheckResponse.json()["result"]["percentComplete"]
print("Download is " + str(requestCheckProgress) + " complete")
progressStatus = requestCheckResponse.json()["result"]["status"]
#Step 2.1: Check for error
if progressStatus == "failed":
raise Exception("export failed")
fileId = requestCheckResponse.json()["result"]["fileId"]
#Step 3: Downloading file
requestDownloadUrl = baseUrl + fileId + '/file'
requestDownload = requests.request("GET", requestDownloadUrl, headers=headers, stream=True)
responsesZip = zipfile.ZipFile(io.BytesIO(requestDownload.content))
responsesFiles = responsesZip.namelist()
responseFile = responsesZip.open(responsesFiles[0])
#Prepare data
df = responsesZip.read(responsesFiles[0]).decode("utf-8")
#Create pandas dataframe
dfp = pd.read_csv(StringIO(df), sep=",")
#Splice csv into responses and questions
questions = dfp.iloc[:1]
dfp = dfp.iloc[2:]
#Return both csv files
dfp_csv = dfp.to_csv(index=False, header=True)
questions_csv = questions.to_csv(index=False, header=True)
return dfp_csv, questions_csv
#Main
#Setting values of variables based on the input of the user in the configuration of the operator
apiToken = api.config.apiToken
dataCenter = api.config.datacenterID
surveyId = api.config.surveyID
fileFormat = "csv"
#Receiving csv files and sending them out in messages
(output_csv, output_questions) = exportSurvey(apiToken, surveyId,dataCenter, fileFormat)
api.send("outputCSV", api.Message(body=output_csv))
api.send("outputQuestions", api.Message(body=output_questions))
After adding this script into your custom operator you can save it and open a new graph that you will use to access your survey data via the Qualtrics API and then save it in a HANA table.
To start off your graph insert the custom python operator you just created and open its configuration to enter the fitting Survey ID, Datacenter ID and API Token you looked up earlier into the respective input ports.
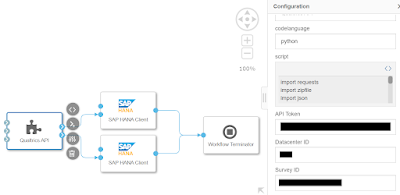
The next step would be to add two SAP HANA Client operators and a workflow terminator. Connect each of the two outputs of your custom python operator with a data port of a SAP HANA Client operator. The “result” outputs of the HANA operators can now both be connected to the workflow terminator.
Inside the SAP HANA Client operators you can now configure your SAP HANA connection and give the respective tables appropriate names. The configurations of the operators should be changed to the following settings:
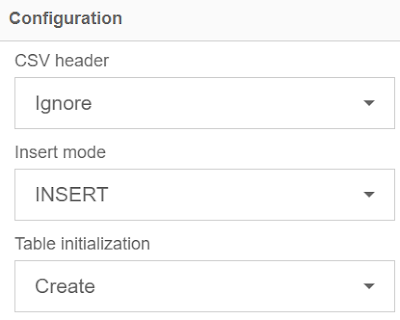
Now the table columns have to be configured.
Each Qualtrics Survey contains 17 columns at the beginning that give information about the respective participant that gave the response and when and in how much time the survey was completed by that user. After those columns the columns for the respective questions in the survey start.
It is important to know that it depends on the question type in what format and in how many columns a questions results are represented. I am going to describe the format for the question types Multiple Choice, Text Entry, Net Promoter Score and Sliders that I also used in my survey since those are some of the most popular question types to use in surveys.
Multiple Choice Questions are represented by just one column that contains the number of the chosen answer as an integer.
E.g. “Q1”: 3, if a participant chose choice 3.
Text Entry Questions are represented by just one column as well and contain a string that was submitted by the user.
E.g. “Q2”: “Lorem ipsum”, if a participant chose to submit the text “Lorem ipsum”.
Net Promoter Score Questions are represented by two columns, the first is the NPS group represented as either 1 (“detractors”), 2 (“passives”) or 3 (“promoters”) the other is the actually chosen option in the range of 0 to 10. Both values are written as integers.
E.g. “Q3_NPS_GROUP”: 3; “Q3_SCORE”: 9, if a participant chose the ninth option.
Slider Questions can have a larger number of columns depending on how many questions/statements you add in them. Per smaller question or statement that a participant has to answer/rate with a slider you have an additional column containing an integer from 0 to 100.
E.g. “Q4_1”: 57; “Q4_2” : 96; “Q_3”: 23, if a participant chose 57 for the first, 96 for the second and 23 for the third question/statement.
Now that you know how those question types are represented you can configure the table columns in the SAP HANA client operator, that will be used to load the responses of the participants, by first adding the columns needed for the beginning that I will provide for you in json format and then adding the columns for your custom questions in the survey either by appending the json data or configuring them through the graphical interface provided by Data Intelligence.
[
{
"name": "StartDate",
"type": "NVARCHAR",
"size": 200
},
{
"name": "EndDate",
"type": "NVARCHAR",
"size": 200
},
{
"name": "Status",
"type": "NVARCHAR",
"size": 200
},
{
"name": "IPAddress",
"type": "NVARCHAR",
"size": 200
},
{
"name": "Progress",
"type": "NVARCHAR",
"size": 200
},
{
"name": "DurationInSeconds",
"type": "NVARCHAR",
"size": 200
},
{
"name": "Finished",
"type": "NVARCHAR",
"size": 200
},
{
"name": "RecordedDate",
"type": "NVARCHAR",
"size": 200
},
{
"name": "ResponseId",
"type": "NVARCHAR",
"size": 200
},
{
"name": "RecipientLastName",
"type": "NVARCHAR",
"size": 200
},
{
"name": "RecipientFirstName",
"type": "NVARCHAR",
"size": 200
},
{
"name": "RecipientEmail",
"type": "NVARCHAR",
"size": 200
},
{
"name": "ExternalReference",
"type": "NVARCHAR",
"size": 200
},
{
"name": "LocationLatitude",
"type": "NVARCHAR",
"size": 200
},
{
"name": "LocationLongitude",
"type": "NVARCHAR",
"size": 200
},
{
"name": "DistributionChannel",
"type": "NVARCHAR",
"size": 200
},
{
"name": "UserLanguage",
"type": "NVARCHAR",
"size": 200
}
]
After the table columns for the main CSV file are configured you can add the ones for the CSV file containing the questions too by entering the respective SAP HANA client operator and adding the same ones you did for the other file. The only change you need to make is setting the type of each column to “NVARCHAR” so it can contain strings.
Now that both SAP HANA client operators are properly configured you should be able to run it. After the workflow is complete and two tables are created in the SAP HANA cloud connection you chose you can set the table initialization in both SAP HANA client operators to “Drop(Cascade)” so you can update your survey responses if needed.
In the SAP Data Intelligence Launchpad you can now go to the Metadata Explorer and browse your connections to find the two tables you created.
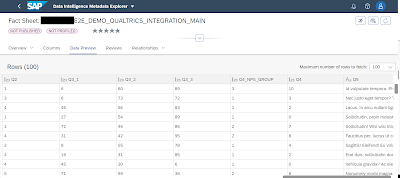
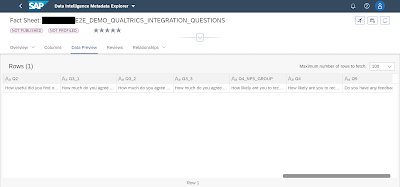
Part 3: Modelling the Data in SAP Data Warehouse Cloud
Now that both tables are configured and saved in SAP HANA Cloud the next step is to import the data you need in SAP Data Warehouse Cloud.
If you have not done so already you first need to go to Connections and add your SAP HANA Cloud connection to your space so you can easily access your data.
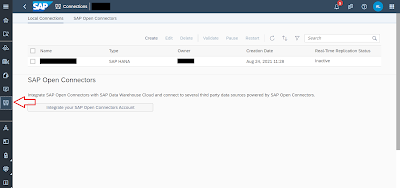
After all of that is configured you can go to the Data Builder and create a new graphical view. In that view you can find your tables by looking in the sources folder under connections. Drag the tables you want to use in the view.
In the case of this demo I will only use the main Qualtrics table containing the responses of the participants although it is of course possible to enrich the data by adding tables containing information about the participants, geodata or other data relating to the questions or the participants that could enhance the later visualization. In this demo I only use test responses that were generated by Qualtrics so I am not able to use further data like that.
If you are satisfied with the view you created you can name it and configure a few measures. Those will probably mainly be the columns containing the question responses. After that you can set its semantic usage to “Analytical Dataset” so you can expose it for consumption and deploy it.
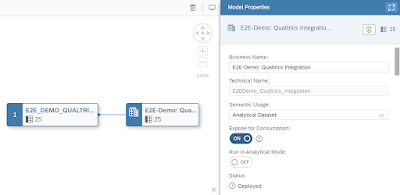
This makes it possible for you to create a Story in SAP Analytics Cloud based on that view.
Part 4: Visualization of the Survey Results in SAP Analytics Cloud
To finally visualize our prepared data from our Qualtrics Survey, first navigate to the Stories tab in SAP Analytics Cloud and create a new responsive story.
On the upper left click on the button that read “Data” to choose which Data Source SAP Analytics Cloud should use for this story. In the pop-up window first click on “Data from a data source”, then “Connect to live data” and “SAP Data Warehouse Cloud”. Next select the space you used to create your analytical view in the previous step and the name of the respective view.
Now the view should be able to access the data you gained from your survey and you can now use the tools provided by SAP Analytics Cloud to visualize your data.
First I am going to show you how to visualize multiple choice questions since those are the most popular type of question in surveys.
To start off choose what Visualization you want for the question. In the case of multiple choice questions bar diagrams or pie charts are a good option.
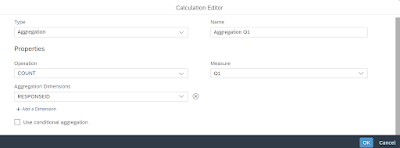
For your measure create a new calculation with the type Aggregation. In the calculation choose the measure containing the data related to your chosen question, set the operation to COUNT and the Aggregation Dimensions to RESPONSEID.
For your dimension create a new calculated dimension with the type Measure-Based-Dimension. Inside the calculation select the same measure you chose in the calculation for your measure and use RESPONSEID for your dimension context. To make clear, what data is displayed in the diagram, define member names based on the response options in your question.


After all of that is done you just need to change the title of the diagram to your respective question and maybe adjust the sorting of the diagram based on your preferences.
For other question types other means of visualization might be more appropriate. For the NPS score for example you might want to create a Numeric Point chart to show the average or show the development of it over a certain time period. To visualize the slider question you should either group values together when using a bar chart or something similar or also just use the average in a Numeric Point.
Either way there are a lot of options to optimally visualize your data in SAP Analytics Cloud based on your preferences and needs.




No comments:
Post a Comment