Standard SAP HANA monitoring tools sometimes require initial configuration or specific setup and this might be a problem when you need quickly jump into the case and check what is happening on the SAP HANA DB side. And this is exactly where RybaFish Charts will help you.
All you need to start using it – just download the tool (no installation required, it is portable) and connect to the database. Within seconds you will be able to check the resource consumption on the database:
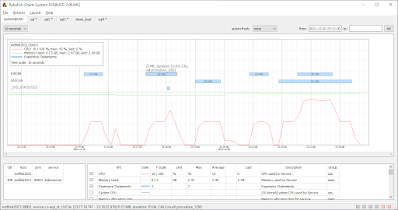
In this case we can see there is some activity on the database: memory consumption is stable and far from the limit and something consuming CPU from time to time.
Having picture like this in front of you it is possible to understand if there are any bottle necks in on the DB side, if memory is close to the allocation limit or CPU is close to 100%… maybe be there are transactional locks hanging?
SAP HANA collects a lot of telemetry about itself and by checking different KPIs you can see what is the situation and how it was evolving. And the rest depends on your experience.
One of the key features of the RybaFish Charts is custom KPIs and today I will only share one with you: “Expensive Statements”. The point is, you can plot executed statements on the very same chart and by doing so you will be able to correlate statements executed in the system with the resource consumption:
Expensive Statements
Here we see that LUCIA and SASCHA are running things and sometimes their executions overlap which results in increased CPU consumption.
This specific KPI is based on the Expensive Statements trace which needs to be enabled to be able to visualize statement executions. At least in 90% cases it allows to identify the troublemaker and take according actions.
RybaFish Charts is an open source project, not developed by SAP, it is openly available for use “as is”.
The interface is simple and straightforward:
Main interface
You just connect to the database and enable required KPIs for your analysis. As mentioned above, no installation required, the tool is “portable”.
Technology stack is Python + Qt.


No comments:
Post a Comment