I’m hoping that the title starting with ‘A First Step…’ implies that we will be continuing the journey with them with a second more detailed course.
Here are my top 10 interesting insights from the course, I hope this will entice you to go do the course yourselves. Here is the link to the course:
https://open.sap.com/courses/hanasql1
(1) HANA has different execution engines
SAP HANA has different query execution engines for different types of processing and the objects involved in the processing, they are broadly categorized into two different types, row engines and column engines, however the new ESX engine tries to handle both. One query can use multiple engines to execute depending on how it is written. This was discussed in Week 1 Unit 2 and gives a good insight into what’s happening ‘under the hood’ of HANA.
Here are a few small examples of how different table types, hints and functions influence the engines that are used.
Explain Plan: Row with Row
Explain Plan: Row with Column
Explain Plan: Column with Row
Explain Plan: Column with Column
Explain Plan: Column with Column (engine hint)
Explain Plan: Column with Column (windows function)
Key Takeaways:
1. You can try influence which engine is used/not used using hints
2. Your query construct will influence the engines that are used, for e.g. if you select off a column table but use a windows function, it will use the Row Engine as this function is only supported in the Row Engine
3. Swopping frequently between engines can be costly
(2) There is an order of execution within SQL Queries
The query execution order is the order in which the query is processed and guides how the query optimizer tree is built. The below diagram is from the course and this is covered in a very detailed example in Week 1 Unit 3:

Key Takeaways:
1. The query has a fixed order of execution which will guide how the optimizer tree is built
(3) HANA has useful system views, namely M_SQL_PLAN_CACHE
Another interesting topic from Week 1 Unit 2 is the SQL plan cache, this is where query plans are stored and the view M_SQL_PLAN_CACHE is how you can report on it. The storage of the query plan is done to minimize the compilation time of the query, simply put, the query execution plan is not recalculated every time you execute it, the query plan is read from the cache (if it is exists and is valid) and used.
If you’re ever tried to find your cache entry or figure out why it wasn’t used or became invalid, then you’ll indulge me for a minute when I say that the plan cache makes me think of a line from the Rednex song “Cotton Eye Joe”, .. “Where did you come from, where did you go?”
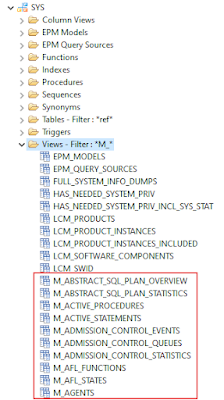
This is a good time to remind everyone that there are plenty of other useful system views, they are documented in the “SAP HANA SQL Reference Guide for SAP HANA Platform”, or can be found by digging around in the views folder of the SYS schema:

Key Takeaways:
1. The plan cache is useful for reviewing the explain plan for a problem that is hard to reproduce as you can try find the plan cache entry for the code that failed
(4) HANA has multiple tools to help you analyze and optimize
There are three different ways to analyse the query and they are covered in Week 2 of the course, here is how they compare:
Note: I’ll keep adjusting this table as I find more differences, please feel free to comment/correct.
| |
SQL Plan Cache
(use this to get to EXPLAIN PLAN)
|
EXPLAIN PLAN (tool)
|
PlanViz (tool)
|
SQL Trace (tool)
|
| Description |
The SQL plan cache is where the plan cache entries are stored for later use. The plan cache entry can be used to access the explain plan. |
The Explain Plan is a quick lightweight tool that shows you a compiled plan in tabular form without executing it. |
The Plan Visualizer is used to create a visualized plan. This will show you have the query executed. |
The SQL trace works on the session layer and captures every single SQL statement that enters the database. |
| Ease of finding entry |
Tricky – Finding an entry in the SQL plan cache can be difficult because the table contains many primary keys. |
Easy – you choose the statement you want the explain plan generated for. |
Easy – you choose the statement you want to execute PlanViz for. |
Easy – switch on trace and then execute statement. |
| Persisted |
Caches are always stored for later use (unless evicted) and therefore their plans as well. |
No – you can however download the results to a file. |
No – you can however download the results to a file. |
Yes in a trace file. |
| Requires statement execution? |
Yes |
Explain Plan does not require the query to be executed. This makes the Explain Plan useful when it comes to hard-to-reproduce issues like out of memory, system hang, and system crash, query only needs to be compiled. |
Offered as a sub-option, the trace can be done after execution or just after preparation. |
Yes |
| Output format |
Tabular Data |
Tabular Data
The Explain Plan is particularly good for analyzing small-sized plans because the whole table can fit onto the screen. You can easily recognize the levels through the indentation, see patterns, and follow figures to find the hot spot. For e.g. repeated engine usage pattern.
|
Visual Map
A visualized plan is a visual map of the operators and their relationships and hierarchies, which are described in a large single tree.
|
Trace file format. |
Key Takeaways:
1. There are various ways to analyse a query, trying the same query across the 3 tools is useful to understand what they each have to offer.
(5) How to “climb” the optimizer tree
In Week 1 Unit 5, the SQL Optimizer is covered in great detail. The lecturers explore how the query optimizer tree is optimized by means of rule-based optimization and cost-based optimization, the end goal being that it runs faster and still produces correct results.
The most interesting part of this section for me was logical enumerators and how they provide different tree shapes and orders. The enumerators influence the position and order of operators for e.g. FILTER and JOIN. Below is a screenshot from the course, the red text is my understanding of how the enumerator was applied.

Enumerators
The different enumerators can be influenced by applying a hint to your code, read the “SAP HANA SQL Reference Guide for SAP HANA Platform” for full list of available hints:

Key Takeaways:
1. Make sure to understand logical enumerators and how they could influence the optimizer tree
(6) Optimization of parameterized queries has a slight difference
In Week 2 Unit 5 there are tips on how to analyze parameterized queries as they behave differently to unparameterized queries.
Key Takeaways:
1. Execute the query normally once to create a plan cache entry
2. Execute the query as a single line (this means to remove all carriage returns)
(7) You should spend time with the column search quartet : “Column search”, “Absorption”, “Pushdown blockers” and “Singular versus Stacked Column Search”
This topic is super interesting and is nicely explained in the course, also read the “SAP HANA Performance Developer Guide” as this goes into much more detail. It is worthwhile reading and absorbing the sections a few times.
Let’s review a few definitions (Bold Black is from the guide / Purple is my interpretation):
| Column Search |
Column search is a composite operator that can be operated in a single IMS search call. An IMS search call is a request from the SQL engine to the column engine, generally with the query execution plan (QE).
In layman’s terms, this means that certain operators (for e.g. JOIN –> GROUP BY –> LIMIT) can be combined into a composite operator (i.e. Column Search operator) and that a single call will be made to the column engine instead of a call per operator.
|
| Absorption |
Absorption is a mechanism that extends the column search boundary across the operators. Starting with the table, the column search moves up along the tree and merges the operators until it meets a blocker that prevents its expansion.
In laymen’s terms, how many operators from original query can be absorbed into the composite operator to be passed along in a single call.
|
| Pushdown Blocker |
A pushdown blocker is defined as anything that prevents the absorption of an operator into an existing column search.
In layman’s terms, a pushdown blocker is anything (for e.g. operator not supported by column engine) that cannot be added into the composite operator, and causes the query to be broken into parts.
|
| Stacked column search |
A stacked column search is where there are multiple column searches stacked on top of each other.
In laymen’s terms, a column search becomes a stacked columns search when it is broken into multiple parts, the stacked term referring to how the tree is stacked to achieve the results i.e. column search 1 feeds into column search 2 feeds into column search 3.
|
I’m sure at this point you’re thinking this is all very interesting but why do we care? We care because of data materialization. This is when the intermediate result is converted into a physical temporary table and temporarily stored in memory. The more column searches that are stacked the more data materialization happens and the costlier the call becomes.
Key Takeaways:
Data Materialization is important and can cause out of memory situations
(8) How to analyze OOMs
Week 2 Unit 7 is a great guide on understanding all the sections of an OOM dump and finding the culprit query, it also guides you to finding the explain plan for the problem query and using that to find what is causing the memory problem.
Key Takeaways:
1. SAP HANA service creates only one OOM dump within 24 hours
2. The monitoring view called M_OUT_OF_MEMORY_EVENTS displays a
list of the last 20 out of memory events
(9) How to identify a Dominant Operators and its possible Key Reducers
Week 3 Unit 2 goes into great detail on how to find your dominant operator and its potential key reducer. A dominant operator is the operator in your query that takes long to process and the key reducer is usually an operator of ancestors of a dominant operator that could reduce the records produced by the dominant operator.
Key Takeaways:
1. PlanViz is a great tool for finding the dominant operator
2. If hints do not help you to move the key reducer to the desired spot then the query might have to be rewritten
(10) SQL Tuning Tips
Week 3 Unit 6 introduces useful SQL tuning types such as using explicit type casting, using partitioning and switching off inlining (useful in certain scenarios). This lead me to the performance guidelines section of the “SAP HANA Performance Guide for Developers” and there is so much more to read, absorb and understand.
Key Takeaways:
1. Make a big strong coffee and read SQLScript Performance Guidelines section from the “SAP HANA Performance Guide for Developers”
2. Stay away from implicit type casting


No comments:
Post a Comment