Login to SAP DataSphere and navigate to path System -> Configuration. Select the Menu option 'Database Access' -> Database Analysis Users.
Select the option Create for new DB user.
Provide the Name of the user along with No# of days the user will be active ( after which the user ID will get deleted) and click on 'Create'.
HAND DB Analysis User will be created and access details will pop up in next screen. Please make not of User Name, Host, Port and Password.
We can see the newly created user under 'Database Analysis Users' along with its status and Validity date.
To Access the SAP HANA Cockpit, check the User Name and click on 'Open SAP HANA Cockpit'
This will take us to new webpage/ tab for HANA DB Cockpit and prompt us to enter the Login details.
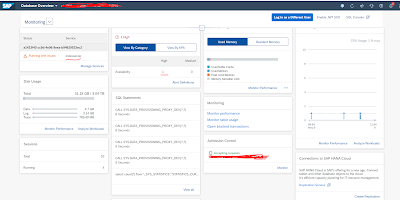
After successful login we land on the Database Overview page of SAP DataSphere HANA DB.
Here we have option to select different view from the drop down menu.
Select Monitoring the see the overall status of the SAP HANA DB. Now, we will explore some key monitoring artifacts like Storage, CPU, Threads, Transactions, etc.,.
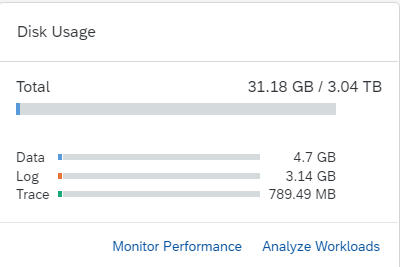
1. Storage Utilization will provide statistic of used disk space against total allocated space of the SAP DataSphere tenant.
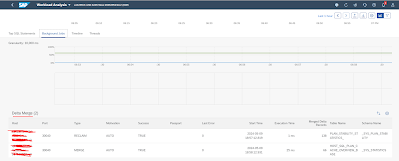
Analyze Workloads will provide details view of 'Top SQL Statements', 'Background Jobs', 'Timeline' & active 'Threads'.
We also have option to select the time period and Filter the view.
Background jobs will show the status of background job, which were schedule for the selected period.
Under 'Timeline', we can monitor different application threads along with duration and status.
In Menu option 'Threads', we can select the different monitoring option for the process threads and see the overall performance. Here I've selected option as 'Thread State', we can also select different option for more detailed view.
It also has option to select 'Secondary Dimension' and monitor the statistics based on selected criteria.
2. Manage Services, will show the overall status of core HANA DB services for the SAP DataSphere tenant.
we can see the service status, Database SID and overall status. Below image shows HANA DB services are running with one high priority alert with in the 'indexserver'. We can also access 'indexserver' trace file by selecting option ' Go to Trace file'.
3. Memory Usage: This menu option provide us high level view of Memory utilization.
To access detailed information on memory utilization, click on option ' Monitoring Performance', This will show us detailed statistical view. we can see memory allocation to different DB components and services.
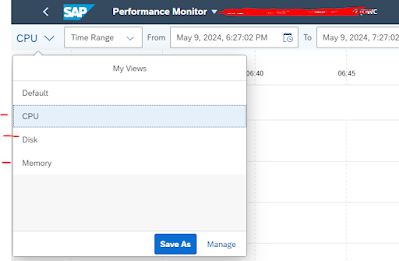
with in the performance Monitor, we also have option to view performance metrics CPU & Memory as well.
More detailed view of Memory usage with respect to Workloads, Buffer Cache and Paging can also be accessed by selecting the option for menu (...).
4. Monitoring Table usage: We can access table space usage statistics from 'Monitoring'
we can monitor the tables and its space utilization and statistics with different spaces.
5. Blocked Transactions: Performance of HANA DB get severely impacted if we have any blocked transaction at the DB level.
We can see the active transaction in blocked status, if any.
6. CPU Usage: We can monitoring overview of CPU utilization and details view can be access with options like 'Monitoring Performance' and 'Analyze Workloads'.
In case we observe any issue, which requires SAP attention than we need to open a support ticket with SAP to get the required help.


No comments:
Post a Comment