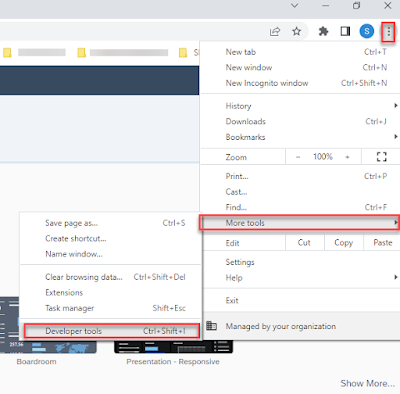
There are tons of different ways how you can performance traces on SAC for troubleshooting. In this blog I will talk about one of the tracing methods called (TIMELINE TRACES) that can be very helpful when there are performance problems being observed in SAP Analytics cloud (SAC) regardless if the connection is with BW or S/4HANA etc.
Step 1:
Log on to your SAC Tenant.
Step 2:
Once you are logged on to the SAC tenant open CHROME developer tools in the same browser window where you have the Tenant open.
Step 3:
Make sure you have your set up like shown below. In the same window you have both the tenant and developer tools open.
Go to the tab PERFORMANCE > Click the GREY Icon to record > Then on the left open your story or widget etc.
Note: Before you start recording, you should first queue up the browser to the beginning of the problematic workflow that you wish to record.
Step 4:
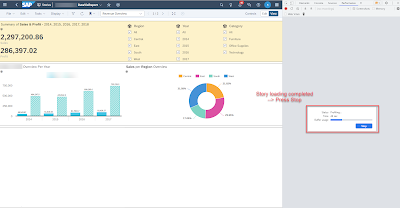
Once you open your story you will see this little pop up indicating you the trace is now being collected.
Depending on your story/dashboard/Widget and its performance issues it could take long for the story to load but that’s fine as on the right hand side you will see the runtime of the trace collection aswell.
Step 5:
Once your Story/Widget is fully loaded then > CLICK STOP
Step 6:
Once you are done you will see the trace showing you a lot of things but the main thing you are interested in first of all is to know which area is the most time consuming (i.e. Loading, Scripting, rendering, Painting, system, Idle). In this case the scripting seems to take most of the time. IDLE time was just me sitting and doing nothing while the trace was running so that also got considered in this trace.
Once that is done you can then save the trace file in .JSON format by RIGHT CLICK AND SAVE PROFILE


No comments:
Post a Comment