Purpose
The purpose of this document is to instruct SAP customers on how to analyse ABAP dumps.
Overview
How to troubleshoot ABAP Dumps
Troubleshooting
When looking at an ABAP system you can sometimes come across runtime errors in Transaction ST22:
The purpose of this document is to instruct SAP customers on how to analyse ABAP dumps.
Overview
How to troubleshoot ABAP Dumps
Troubleshooting
When looking at an ABAP system you can sometimes come across runtime errors in Transaction ST22:
Clicking into the "Today" or "Yesterday" tab will bring up all the ABAP Runtime errors you have encountered in the past 2 days.
You can also filter the dates for a particular dump by using the filter feature:
Here are some examples of runtime errors you might see in ST22:
So from looking at these dumps, you can see
1: Category
2: Runtime Errors
3: ABAP Program
4: Application Component
5: Data & Time.
The ST22 dumps do not not really give you much information here so more information will be needed.
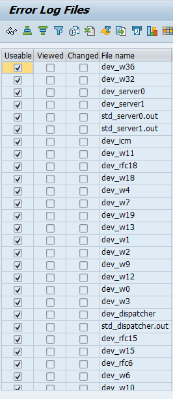
For more information you will then look into the Dev_W files in the transaction ST11
ST11 allows you to look further into the Dev_w files relating to the dumps in ST22:
To find the work Dev_w file that corresponds with the dump, you can see this is ST22.
Go to ST22 > click on the Runtime Errors for "Today", "Yesterday" or a filter. This will being up the specific dump you wish to analyse.
Here you will see 11 columns like so:
Here you can see the columns I have mentioned. The Work Process Index number you need is in the column named WP Index.
Once you find the dev_w index number you can then go to ST11 and find further information:
In the ST11 Dev_w files you have to match the time of the dump in ST22 with the recorded times in the Dev_w process files.
If there no useable information in the Dev_W files, the next step would be to analyse the issue from the Database side.
To analyse from the Database side:
1. Open HANA Studio in SAP HANA Administration Console View
2. Check the diagnosis trace files in accordance with the time stamp of the dump you saw previously in ST22. To do this we have to go to the Diagnosis tab in HANA Studio:
3. Check the time stamp from the ST22 dump (Date and Time), and then match this accordingly with the time in either the Indexserver.trc or nameserver.trc.
Search for the corresponding time stamp mentioned above i.e. 18/11/2015 @ 10:55:43.
Or instead of searching you could use the below SQL:
select top 500 service_name, timestamp, trace_text from m_merged_traces where service_name in ('indexserver', 'nameserver') and timestamp between '2015-11-18 10:40:00' and '2015-11-18 10:59:00'
Searching the nameserver log files can be a good indication of whether your ST22 is related to network issues, you may see errors such as:
TrexNet Channel.cpp(00339) : ERROR: reading from channel 151 <127.0.0.1:<host>> failed with timeout error; timeout=10000 ms elapsed [73973]{-1}[-1/-1] 2015-01-28 01:58:55.208048 e TrexNetBuffer BufferedIO.cpp(01092) : channel 151 from <127.0.0.1:<host>>: read from channel failed; resetting buffer
If you do find some errors similar to the above, firstly check which host the error is pointing to and check whether or not this service was available at the time of the dump.
If this does not yield any useful information, the next step is to ask someone from your network team to look into this. Checking the var/logs/messages is always a great place to start.
Source: scn.sap.com


No comments:
Post a Comment