Introduction
As my first blog on the SAP Community, I would like to tell you a little story. A few months ago I joined an AMS project and some of my daily tasks involved a twice-a-day monitoring on some SAP Cloud Integration iFlows and a few SAP S/4HANA applications like Message Monitoring, Manage Output Items, etc.
In the beginning I took my time in analyzing the payloads and error sources because there were many scenarios and I could not evaluate them as fast as I can now, but because I got better at doing my job I ran into the need of fetching all the messages with their details in a more efficient way.
The SAP Cloud Integration monitoring part was a bit faster because the iFlows did not have that many errors on a daily basis, 99% percent of the messages processed in SAP Cloud Integration were succesfully.
On the other side, the messages proccesed in SAP S/4HANA were a bit more variate and it took much longer to gather all the error texts, timestamps, message IDs, etc.
To be more precise, I had to monitor the following apps :
◉ Message Monitoring
◉ Application Log ( for 3 message types )
◉ Currency Exchange Rates
◉ Manage Bank Messages ( for incoming/outgoing messages )
◉ Manage Output Items ( for 2 message types )
◉ Application Jobs
Adding the time spent on all of these applications resulted to 30 to 60 minutes per monitoring, and I had to do this twice a day.
This need fueled my creativity and I started to draw a plan on how I could do my monitoring task faster and smarter.
The discovery that generated an idea
I went on the SAP Help Portal on the OData API page and I also did a research on SAP API Business HUB hoping I will find any API that I can use in order to get everything i need, but I didn’t find anything related to a dedicated API for monitoring/exposing the messages.
I asked some of my experienced colleagues for any advices regarding this exhausting part of the monitoring, but they did not have that many ideas, because we are all experienced in Cloud Integration, not SAP S/4HANA.
One day, a colleague gave me a tip to go in an app and go to Inspect > Network to check the calls that are being made in the background when I hit the ‘Go’ button in order to display the messages processed in the specified datetime period.
There, I saw that everytime i hit Go, a GET call is being made and then all the data was displayed.
Inspect – Network – Headers
Also, by clicking the Payload Tab, I was able to see the whole query, with the odata entity and the query parameters.
Inspect – Network – Payload
Doing the same GET request via browser
This discovery made me think if I could do the same calls from SAP Cloud Integration and process the payload in a certain way that in the end, I could have the following data from each app :
◉ Total Messages
◉ The timestamp of the last processed message.
◉ If there are any errors, I would like to have the Message ID and the Error Text.
With this idea in my mind, I started creating a SAP Cloud Integration iFlow that will automate this task and process the messages fetched from SAP S/4HANA.
Core iFlow design
In this chapter I will talk about the general structure of the iFlow, as I did ‘split’ it into a main process and 3 types of local processes :
◉ Type 1 – Applications that require multiple calls for different type of messages ( for example Application Logs – required to monitor messages for 3 types : POSTING, PROJECT and EXCHANGE_RATES
◉ Type 2 – Applications that don’t require a split since it’s a single type of message being fetched
◉ Type 3 – Assigned to the Currency Exchange Rates app, for which is necessary to check only if all the 433 exchange rates have been imported or not, since the app does not offer any sort of error message or debugging.
Main process
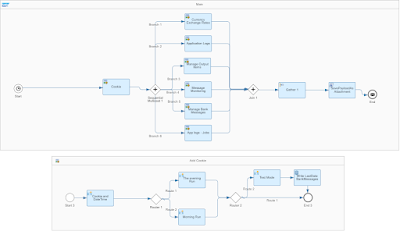
Main Process
The iFlow is designed to run twice a day, at 9:30 AM ( morning run ) and at 4:30 PM ( evening run ).
In the morning run, the interface would pick all the messages received between the day before at 4:30 PM and the current day at 9:30 AM. In the evening run, it would pick the messages between the current day at 9:30 AM and the current day at 4:30 PM.
The ‘Add Cookie’ Local Integration Process is used to set some date/time parameters for later use and the session cookie.
I found out that without the session cookie generated when I log into SAP S/4HANA I could not establish connection between SAP Cloud Integration and SAP S/4HANA. This part is still in development, I still haven’t figured out a way to generate or fetch that cookie from SAP Cloud Integration, right now I manually add it into the iFlow everytime I configure/deploy it.
The router non-XML condition is comparing the datenow expression with a constant value datenow 11:30 AM, so basically if the datenow parameter generated is bigger than 11:30 AM, it will go in the evening run.
The second router is used in Test mode, so I can Configure the iFlow and use any datetime interval I choose.
Type 1 Local Process – Application Logs, Manage Output Items and Manage Bank Messages
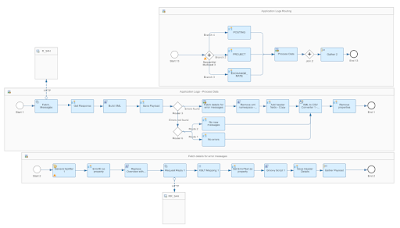
Type 1 Local Process
I used 3 local processes in order to fetch/process the messages for this application, and here is the logic :
◉ In the Application Logs Routing Local Integration Process I use a sequential multicast in order to set the SubObject exchange property for the 3 neccesary types.
◉ For the HTTP call I use the following link : https://{{system-url}}/ /sap/opu/odata/sap/APL_LOG_MANAGEMENT_SRV/ApplicationLogOverviewSet/ sap-client={{client}}&$skip=0&$inlinecount=allpages&$top={{toptotal}} &$orderby=CreatedAt%20desc&$filter=(Object%20eq%20%27CONCUR_INTEGRATION%27%20and%20SubObject%20eq%20%27${property.SubObject}%27)%20and%20(SearchDatetime%20ge%20datetime%27${header.Previousdate}%27%20and%20SearchDatetime%20le%20datetime%27${header.Nextdate}%27)&$select=Severity%2cMessageTotalCount%2cObjectText%2cSubObjectText%2cCreatedAt%2cCreatedByFormattedName%2cObject%2cExternalNumber%2cCreatedByUser
{{system-url }} – the link to the desired SAP S/4HANA system
{{toptotal}} – desired number of max. items returned, I set mine to 300 because we don t have more than 100 daily messages per app.
Object – is supposed to be CONCUR_INTEGRATION since that’s what I’m monitoring
${property.SubObject} – the object set in the Routing Local Integration Process
${header.PreviousDate}, ${header.Nextdate} – dates from the main flow that set the query interval.
◉ Use a Groovy Script to build a XML structure that will be used for the rest of the flow logic :
import com.sap.gateway.ip.core.customdev.util.Message
import groovy.xml.MarkupBuilder
import java.time.LocalDate
import java.time.format.DateTimeFormatter
Message processData(Message message) {
// Access message body and properties
Reader reader = message.getBody(Reader)
Map properties = message.getProperties()
// Define XML parser and builder
def feed = new XmlSlurper().parse(reader)
def writer = new StringWriter()
def builder = new MarkupBuilder(writer)
// Define target payload mapping
builder.Messages {
'Header' {
'Total_Messages'(feed.count)
'Last_Message_Timestamp'(feed.entry[0].content.properties.CreatedAt)
}
def validItems = feed.entry.findAll { entries -> entries.content.properties.Severity.text() == 'E' }
validItems.each { entries ->
'ErrorItem' {
'ItemID'(entries.title)
'ItemType'(entries.content.properties.SubObjectText)
'Severity'(entries.content.properties.Severity)
}
}
}
// Generate output
message.setBody(writer.toString())
return message
}
In the Header Node I store the last message timestamp and the total number of messages, and for each item from the response that satisfies the condition Severity = ‘E’ ( error ), create a ErrorItem node with its specific fields.
◉ Saving the payload in a property for any later use.
◉ Route the message based on its content :
For any errors found go to the next Local Integration Process and fetch the errors
For no errors found [ route condition : //Messages/Header/Total_Messages >= ‘0’and not(//Messages/ErrorItem/ItemID/node()) ] but with any successful message found send only the saved payload in step 4)
For not only no errors found but also no new messages [ route 2 condition //Messages/Header/Total_Messages = ‘0’ ] send forward the following payload
<Messages>
<Header>
<Total_Messages>0</Total_Messages>
<Last_Message_Timestamp>0</Last_Message_Timestamp>
</Header>
<root>
<ErrorItem>
<Text>No New messages for Application Logs</Text>
</ErrorItem>
</root>
</Messages>
Sample scenario with at least one error message found
Let’s take the following scenario with 21 total messages, of which 2 are in error status :
<Messages>
<Header>
<Total_Messages>21</Total_Messages>
<Last_Message_Timestamp>2022-03-06T18:00:13</Last_Message_Timestamp>
</Header>
<ErrorItem>
<ItemID>ApplicationLogOverviewSet('%7BXO%7BsE9q7koc%7BcTnm2Gs50')</ItemID>
<ItemType>Financial Posting</ItemType>
<Severity>E</Severity>
</ErrorItem>
<ErrorItem>
<ItemID>ApplicationLogOverviewSet('%7BXO%7BsE9q7koc%7BcTnm2IM50')</ItemID>
<ItemType>Financial Posting</ItemType>
<Severity>E</Severity>
</ErrorItem>
</Messages>
This payload goes in the ‘Fetch details for error messages’ Local Integration Process and gets processed with the following steps :
◉ General Splitter splits based on each ErrorItem
◉ A property ErrorID is being set based on the value from ItemID, being used for the next GET call.
◉ In order to do the following call, it was required to replace ApplicationLogOverviewSet to ApplicationLogHeaderSet, and I achieved that with a simple groovy script.
import com.sap.gateway.ip.core.customdev.util.Message;
import java.util.HashMap;
def Message processData(Message message) {
//Body
def body = message.getBody(String) as String;
message.setBody(body.replaceAll("Overview","Header"));
return message;
}
◉ Fetch the error details using the following address : https://{{system-url}}//sap/opu/odata/sap/APL_LOG_MANAGEMENT_SRV/${property.ErrorID}/ApplicationLogMessageSet/? $skip=0&$top={{toptotal}} &$select=Type%2cText%2cTimestamp%2cHasDetailText%2cHasLongText
Here is the Response Body :
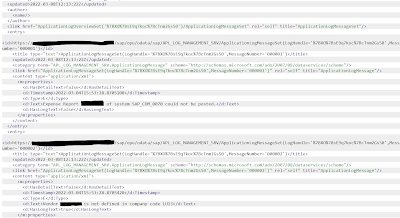
Response body
<?xml version="1.0" encoding="UTF-8"?>
<xsl:stylesheet version="1.0"
xmlns:m="http://schemas.microsoft.com/ado/2007/08/dataservices/metadata"
xmlns:d="http://schemas.microsoft.com/ado/2007/08/dataservices" xml:base="https://{{s4h-url}}/sap/opu/odata/sap/APL_LOG_MANAGEMENT_SRV/"
xmlns:xsl="http://www.w3.org/1999/XSL/Transform"
exclude-result-prefixes="m d xsl">
<xsl:output method="xml" />
<xsl:template match="/">
<result>
<xsl:apply-templates select="//d:Text"/>
</result>
</xsl:template>
</xsl:stylesheet>
◉ Save the body after the XSLT mapping under a property, and add it into our base XML under the node ‘ErrorDetails’ using a groovy script :
import com.sap.gateway.ip.core.customdev.util.Message;
import java.util.HashMap;
import groovy.xml.XmlUtil;
import groovy.util.*;
def Message processData(Message message) {
def body = message.getBody(java.lang.String);
def root = new XmlParser().parseText(body)
def mapProperties = message.getProperties();
def valueDef = mapProperties.get("ErrorDetails");
root.ErrorItem.each { row ->
row.appendNode("ErrorDetails",valueDef)
}
message.setBody(XmlUtil.serialize(root));
return message;
}
◉ Save the header fields sincethe gather step would append all the messages splitted by the general splitter under the Messages/ErrorItem source and combine them under a root node. As an example, he’s the output at the end of this Local Integration Process :
<root>
<ErrorItem>
<ItemID>ApplicationLogOverviewSet('%7BXO%7BsE9q7koc%7BcTnm2Gs50')</ItemID>
<ItemType>Financial Posting</ItemType>
<Severity>E</Severity>
<ErrorDetails>Expense Report - / - of system - could not be posted.Vendor - is not defined in company code -</ErrorDetails>
</ErrorItem>
<ErrorItem>
<ItemID>ApplicationLogOverviewSet('%7BXO%7BsE9q7koc%7BcTnm2IM50')</ItemID>
<ItemType>Financial Posting</ItemType>
<Severity>E</Severity>
<ErrorDetails>Run System 1Expense Report: Financial Posting completed with 1 successful document(s).Expense Report: Financial Posting failed for 1 documents.Financial Posting took 4 seconds.</ErrorDetails>
</ErrorItem>
</root>
◉ Remove the xml namespace and add back the removed header fields.
◉ Use a XML to CSV converter with the source path Messages/root/ErrorItem
◉ Remove all the used properties/headers for performance purposes and use the following expression in the Message Body :
\n
Application LOGS for ${property.SubObject}
${in.body}
\n
◉ Inspect the final output :
Application LOGS for POSTING
LastMessageTimestamp,TotalMessages
2022-03-06T18:00:13,21
ItemID,ItemType,Severity,ErrorDetails
ApplicationLogOverviewSet('%7BXO%7BsE9q7koc%7BcTnm2Gs50'),Financial Posting,E,Expense Report - / - of system - could not be posted.Vendor - is not defined in company code -
ApplicationLogOverviewSet('%7BXO%7BsE9q7koc%7BcTnm2IM50'),Financial Posting,E,Run System 1Expense Report: Financial Posting completed with 1 successful document(s).Expense Report: Financial Posting failed for 1 documents.Financial Posting took 4 seconds.
Application LOGS for PROJECT
Total_Messages,Last_Message_Timestamp
2,2022-03-05T17:55:50
Application LOGS for EXCHANGE_RATE
Total_Messages,Last_Message_Timestamp
2,2022-03-06T08:15:34
Specific scenario for the Manage Bank Messages App
Because this app is a bit different than the other ones and does not provide a datetime filtering of the type ‘ from the Lastdatetime until NextDateTime’ and only based on LastDate OR LastTime.

Type 1 Manage Bank Messages
I had to store the last processed timestamp in a global variable, read it before the start of the Process Error process, filter the fetched messages so it processes everything after the stored timestamp and write it back at the end.
Type 1 Manage Bank Messages
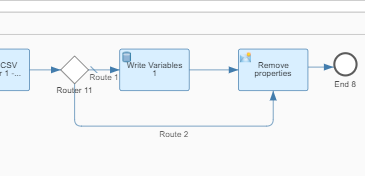
The 2 routers are placed to avoid reading/writing the variables and instead use the value sent in the externalized parameter used by Test Mode.
Type 2 Local Process – Application Job, Message Monitoring
Type 2 Process
This type is basically identical to the first type, except it lacks the ‘routing’ part, since it’s not necessary to do multiple calls based on the message type.
Type 3 Local Process – Exchange Rates
Type 3 Process
This type is the simplest of them, uses the same logic and only requires a comparison between the total number of exchange rates updated the day before the current date.
The Route 2 [ //Messages/Header/Total_Messages = ‘433’ ] sends the following message body :
<Messages>
<Header>
<Total_Messages>${property.Totalnr}</Total_Messages>
<Last_Message_Timestamp>${property.Timestamp}</Last_Message_Timestamp>
</Header>
<root>
<ErrorItem>
<Text>All 433 exchange rates have been updated for ${property.Timestamp}</Text>
</ErrorItem>
</root>
</Messages>
While the route 3 [//Messages/Header/Total_Messages = ‘0’] sends a message saying an error has occurred or no updates were made since the last run ( for the evening monitoring ).
The end of the iFlow
All of the local processes payloads are being gathered and concatenated as plain text, and in the end we have a message containing all the message details under csv format.
I chose CSV format because in the end I have to add all of these informations in an excel and send it to my project managers.




No comments:
Post a Comment