If you are a ERP/NetWeaver system administrator, you will face many scenarios where you experience high resource utilization in the HANA DB. In order to correct these situations, you need to analyze the root cause of this load. This blog post will help you in the analysis process to find the root cause of the load. It will help you find the exact application user which caused this load on your HANA DB.
When get reports from your monitoring tools or users about performance issues in the system, do the following:
◉ Login to HANA Cockpit
◉ Open the Database (usually tenant) which is affected by the issue.
◉ Go to CPU Usage -> Analyze Workloads
◉ In the top chart, you will notice a peak in the CPU usage of the DB. Select the time-frame of the issue to reduce the scope of details.
◉ On the left side, you should see main contributors to the load during that time frame. Click on any of these to see the statements which contributed to the load:
◉ On the right side, you will see the load contributing statement. You can click the more link in the Statement Information to see the statement and you can see the total execution time to give you indication about the load caused by the statement. It is useful to look into the execution count, too.
◉ Here is an example of a statement that you will see in the statement details:
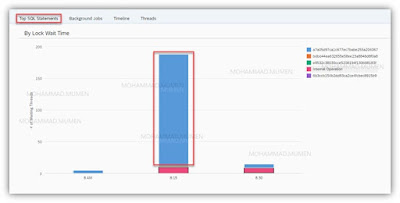
◉ In order to link the load to application users, go to the threads tab, click on the application user on both the primary and secondary dimensions. You will see the contributing application users on the graphs:
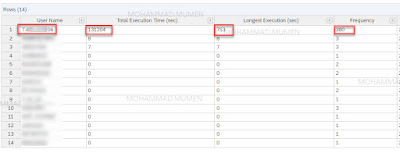
◉ If it is not obvious which application user is causing the load in steps 5 to 8, you can run the below two SQL statements to help you find out the high load statements:
SELECT TOP 1000
"APPLICATION_USER_NAME" "User Name",
to_integer(sum("DURATION")/1000) "Total Execution Time (sec)",
to_integer(max(duration)/1000) "Longest Execution (sec)",
count("APPLICATION_USER_NAME") "Frequency",
to_char(min(timestamp), 'yyyy-mm-dd HH24:mi:ss') as "First Execution" ,
to_char(max(timestamp), 'yyyy-mm-dd HH24:mi:ss') as "Last Execution"
FROM "M_SERVICE_THREAD_SAMPLES"
Where timestamp > '2022-03-22 08:10' and timestamp < '2022-03-22 08:30'
and APPLICATION_USER_NAME <> ''
and APPLICATION_USER_NAME <> '?'
and APPLICATION_USER_NAME <> '_SYS_STATISTICS'
group by APPLICATION_USER_NAME
order by "Total Execution Time (sec)" desc
You can see the user, total execution time, longest execution and frequency.
◉ For exact statements, you can run the following:
Select
TIMESTAMP "Date/time", CLIENT_IP, CLIENT_PID, APPLICATION_USER_NAME "User", PASSPORT_ACTION, LOCK_WAIT_NAME, LOCK_OWNER_THREAD_ID, LOCKS_OWNED, to_integer(DURATION/1000) "Execution Time (sec)", THREAD_DETAIL "SQL Statement"
FROM "M_SERVICE_THREAD_SAMPLES"
Where timestamp > '2022-06-07 09:20' and timestamp < '2022-06-07 09:22'
and APPLICATION_USER_NAME <> ''
and APPLICATION_USER_NAME <> '?'
and APPLICATION_USER_NAME <> '_SYS_STATISTICS'
order by DURATION desc
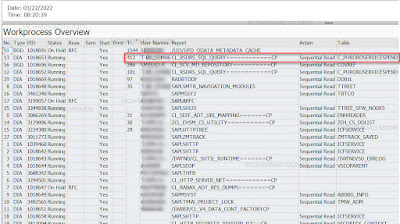
◉ You can confirm from SAP side about the running transaction/job details by accessing SE38 -> /SDF/SMON and SM37. You can see from the snapshot the activity from the user and the report and table details. Be aware that the last SQL statement shows you the Application server which initiated the connection and the process ID which help to find out that matching matching process in /SDF/SMON.
At this stage you can contact the developer of the statement, report to SAP, or perform a trace to further understand why the load occurs. Usually, it will be either an unoptimized statement, or unnecessarily selected data (variant need to be more specific).
As you can see, HANA provides very great tools and resources to analyze load situation. It is very essential for HANA system administrators to be aware of these analysis tools as they need them for root cause analysis. There are many other M views similar to the ones used in the above SQL statements which are really worth exploring as they are like a swiss-knife of HANA administration.


No comments:
Post a Comment