Overview:
The SAP HANA cockpit Dump File Viewer is a new application introduced in SAP HANA cockpit SP 13. It can be utilized for displaying critical state information and simplifying the analysis of database performance issues. When there is an error situation in SAP HANA and a dump file is created, the Dump File Viewer can help users to easily view, analyze, and navigate within the dump file contents to determine the cause of the problem. There are different types of dump files available to analyze:
More Info: C_HANATEC_12 Key Points
◉ RTE – A runtime environment dump that is manually created by running the “runtimedump dump” command in the hdbcons command-line tool.
◉ OOM – An out of memory dump that is created when the system runs into an out of memory situation.
◉ Crash – A crash dump that is written when SAP HANA runs into a situation that causes the operating system (OS) process to crash.
The format is similar between the different dump files: a text file with header, followed by a table of contents that lists the contained sections. The size of a dump file can be greater than 2GB and is located in the ./<hostname>/trace/ server directory or on the user’s local computer.
The aim of the Dump File Viewer is to provide database administrators (DBAs) with a simple and centralized tool to add multiple dump files and quickly get to know more information about the issues. This blog introduces you to the SAP HANA cockpit’s Dump File Viewer tool and how it can be used to perform various troubleshooting operations.
Prerequisite: You need an SAP HANA dump file to load into the tool.
Launching the Dump File Viewer:
◉ In the SAP HANA cockpit home page, you can find three tabs (Monitor Landscape, Manage Landscape, SAP ONE Support).
◉ Look for the tile “Dump File Viewer” under SAP ONE Support and click on it to launch it.
The Dump File Viewer:
◉ When you launch the Dump File Viewer from the cockpit, you will get the below screen. Initially, it will all be empty until you add one or more dump files.
◉ Use the “Add Dump File” button to browse and add your dump file.
◉ Once you add a dump file, the tool automatically starts parsing it and you will find details related to host, service, database, version, and the time of generation of the dump file.
◉ You can add multiple dump files and find out more information about each of them. You can also compare dump files that are from the same database and host.
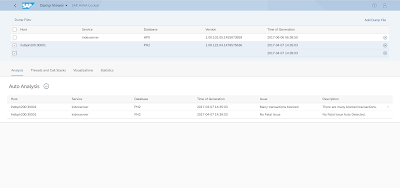
◉ The main Dump File Viewer app has four tabs: Analysis, Threads and Call Stacks, Visualizations, and Statistics.
◉ In the auto analysis table, along with host, service, database, and time of generation details, you can find information about the issue and some additional description. When auto analysis is selected, the tool processes the dump files and tries to automatically detect the issues. The issues supported include many running threads, high workload, index handle states, crash, save point blocked, wait graph, many transactions blocked, and composite OOM.
◉ You can navigate to the analysis page for each entry (i.e. dump file) in the table using the navigation arrow at the end of the row.
Let’s investigate two examples for the analysis section:
1. Analysis: Blocked Transactions
For a dump file whose issue is related to a blocked transaction, you see the below screen.
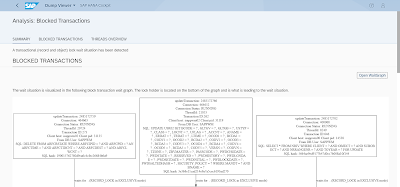
In the Blocked Transactions tab, the lock holder is located at the bottom of the graph and leads to the wait situation. The wait graph shows which thread is making other threads wait.
Switching the tab to the threads overview displays the flame graph showing all threads.
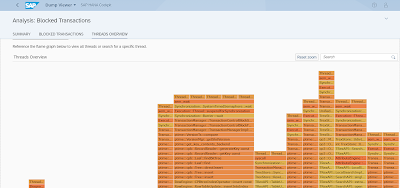
With this available information, you can now understand the first signs of blocked transactions; poor application response or alerts 49 or 59 getting raised. Description in the summary and blocked transactions tabs emphasizes on these signs.
The following steps describe a potential way to solve this problem:
◉ Get information about the lockholder and blocked transactions on application level.
◉ Contact the user who is executing the lockholder transaction to get details of the activity.
◉ If re-occurrence is likely from an end-user perspective, then contact the application owner and (if necessary) the developer to get preventive measures identified.
◉ Cancel the blocking transaction if required.
2. Analysis: OOM
When all memory defined by parameter “GLOBAL_ALLOCATION_LIMIT” is used up, SAP HANA will run into OOM. Looking at the “Analysis: OOM” page, you can find four sections: Global allocation limit and inter process memory management, Memory consumption distribution on connections, Concurrency memory flame graph and Memory allocator flame graph.
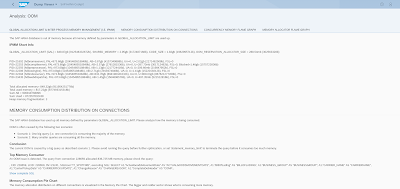
The current OOM is caused by a large query consuming most of the memory. Possible solutions include avoiding running the query before further optimization or setting “statement_memory_limit” to terminate the query before it consumes too much memory.
The OOM dump file contains information about allocated memory and limitations that can be evaluated to understand the root causes of high memory consumption and OOM dumps:
◉ Collection of general memory information
◉ Identification of the responsible threads and connection
◉ Identification of responsible SQL statements
◉ Further troubleshooting: If you determined the critical memory consumers (thread, connection, heap area, SQL statement) but you are not able to understand the root cause, you can have a look at SAP Note 1999997, containing further details for memory troubleshooting.
Now, back at the Dump File Viewer main page you can find different analysis options, with auto analysis selected by default.
◉ Selecting “Build Info Analysis” displays a table showing build information.
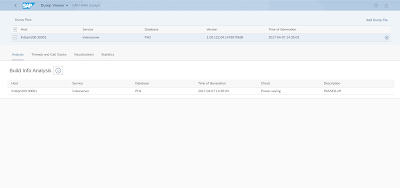
◉ Use the “IO Analysis” option to check for average read/write log speed, the IO status and other IO information. You can find status, value, and expected value columns under this selection. If the expected value condition is satisfied, the status shows passed. Otherwise, the status shows a failure along with the calculated difference between the expected and the generated value in percentage.
◉ Selecting “Threads vs. Processors” displays details related to number of processors, active threads, and percentage of processors in use.
◉ Now, let’s change the tab from analysis to threads and call stacks. The threads section shows a tree table of the threads where you can find out if the thread status is active or inactive. You can filter threads with respect to Status, SQL, and Stack columns. Call stack information of the selected active node is available below the threads table.
◉ Visualization tab: The tab shows a flame graph of the call stack info for a dump file. When you search using the search bar, the corresponding search results are highlighted in pink colored boxes.
You can also click on a particular box to get the expanded view and you can click on the “Reset Zoom” button to restore the initial state of the graph.
If you have added multiple dump files from the same host and database, you can find a segmented button with a time stamp that can be used to switch to a different dump file.
◉ Statistics tab: This tab shows the statistics of the dump file where you can select different tables using the down arrow button next to the table name. The popover includes a search bar to search a specific table and the list is scrollable if there are many tables. You can also switch to a different dump file using the segmented button with a time stamp.
You can also download the tables in Microsoft Excel format using the download button. A message toast will confirm if the download is successful or not.


No comments:
Post a Comment