With the release of SAP S/4HANA 2020 Feature Pack 1 (onPremise), DMEEX receives one of the biggest updates in its lifetime. We implemented a tool that opens and clarifies DMEEX Engine processing. In this tool, you can see and analyze how the DMEEX tree was processed in detail, without the need to debug its code. We call this tool the DMEEX Trace Tool.
DMEEX Trace Tool
DMEEX Trace Tool is here to help you to analyze the problems that often happen during DMEEX Tree creation or modification. Don’t you understand why the node, or the level is missing in the output file? Why the mapped value is in a different format than expected? Or would you like to understand how the conditions are processed internally? DMEEX Trace Tool can help you to get the answers.
How it works in a nutshell
As you know, the user can’t see into the processing of the output file in DMEEX. User knows only inputs (structures) and outputs (files). We opened the generation process with the DMEEX Trace Tool.
The user can mark certain nodes or the whole tree as “to be traced”. For the selected nodes or the whole tree extensive log in XML format (Trace Log) is generated simultaneously with the output file. When the process of file creation ends, Trace Log is stored in the database. But we didn’t stop here.
We created the separate transaction with code “dmeex_trace”, which implements a graphical user interface that interprets the XML Trace Log. Because of this approach Trace Log can be presented to the user in an interactive and intuitive form-factor.
Enabling the DMEEX Trace Tool
You enable the new tracing functionality similarly like breakpoint. Enter the DMEEX tree in display or change mode and right-click the node that you want to analyze. Trace functionality will be enabled for the node you selected as well as for all predecessors above it in the node hierarchy. This ensures that the user receives all context in case for example condition fails in one of the predecessors.
Alternatively, user can select the whole tree as a matter of tracing. In this case, especially for larger tree and/or input data, processing can last a little longer than without tracing and consumes more system memory.
In both cases described, “tracepoint” is valid for 5 days for the user who set it..
You can set the Trace Point for single node (left-side) or for the whole tree.
Execution
As soon as the user enables the node or the tree with tracepoint, Trace Log is being created together with file generation regardless of integration or tree type. In the other words, it does not matter if the tree is executed as a part of Payment Medium Workbench, DMEEX Test Tool or other process.
The Initial Screen
The Initial Screen contains all the Trace Logs stored in the database. User can display certain Trace Log by selecting it and clicking on glasses icon in the toolbar of the application. User can also perform deletion of Trace Logs as well as importing Trace Log from the other system.
Table records themselves contain general data about stored Trace Logs like Tree ID, Tree Name, when the log was generated, who triggered the engine run, and identification about the origin of the Trace Log. Trace Log can either be generated right on the current system – “S” or it can be uploaded externally – “E”.
The initial screen of the DMEEX Trace Tool
The Detail View
The Detail View is presented to the user after the selection of certain Trace Log from the Initial Screen. The layout of the detail view is very similar to DMEEX transaction. It does not display the tree definition like DMEEX, but the recording of „what was done“ inside DMEEX Engine.
On the left side of the screen there is a tree, which displays all the nodes that were marked with Tracepoint in the order they were processed by the engine. Also, if there are repetitions in the tree processing the DMEEX Trace Tool will display them accordingly.
On the right side of the screen the captured data during the engine run are visible. The right side is differs based on the node type.
DMEEX Trace Tool: Detail view
The visual of the main node.
Besides the general information like Tree Type, Tree ID, etc. user can see how long it takes to generate the file using DMEEX in the “Statistics” section.
Bellow the statistics section you can find a table that contains a skipped keys of input data. As you know DMEEX enables users to define key fields for a certain level. DMEEX uses this information to build iterations over the levels – number of unique keys equals number of repetitions of the level in the output file.
What we often see, based on customer feedback, are some iterations missing from the output file. In almost all cases the problem is caused by incorrectly defined key field, often by the usage of length and offset.
Analyzing Conditions
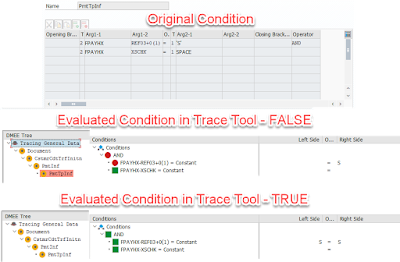
The conditions are being processed recursively by the engine. Trace Tool can show you the recursion tree. Each line starts with either green or red icon indicating the result of partial expression. Logical operators like AND or OR are always evaluating two expressions below them in the hierarchy.
Each line continues with the types that are being compared eg. “Constant = Structure Field”. As the last thing actual values of the fields eg. “1 = 2”.

Condition evaluation in the DMEEX Trace Tool
Analyzing Mapping
The mapping section can be found on all mapping nodes – element, technical node, XML attribute and atom. It can provide you an insight on how the value was processed internally. It all starts with the value of the source field. Then, as you can see from the screenshot, DMEEX Trace Tool provides you all important values from the conversion perspective – length, target offset and conversion function. Also, it can show you the internal type in which the value was processed. For more information about this, please read the appendix of this blog post.
The last field in this section is “Output value”, which is the input value after applying all conversions (length, t. offset, conversion function).
In DMEEX Trace Tool, you can see how the value was transformed from the input value into the output value of the node
Analyzing Aggregations
From the standpoint of the engine, aggregations are calculated on the node where the value in mapped form the input data (source node for aggregation) and then the value is referred to the node where user selected the aggregation to be outputted (target node for aggregation). In DMEEX Trace Tool you can find how the aggregation was calculated on every so-called source node for aggregation.
DMEEX Trace Tool also highlights every source node for aggregation with yellow color.
Example of aggregations in DMEEX Trace Tool
I want this!
DMEEX Trace Tool is available for all supported SAP S/4HANA onPremise releases from following support packs:
◉ 2020 FPS1
◉ 1909 SP4
◉ 1809 SP6
◉ 1709 SP8
◉ 1610 SP10
or via SAP Note 2971766 – DMEEX – Correction Pack 2102. However we always recommend to implement the latest correction pack note for DMEEX by the time of publishing this article, it is 2993694 – DMEEX – Correction Pack 2105.
Wrap-up
Configuration of the DMEEX can be tricky and DMEEX Trace Tool is here to help you with the analysis of the tree behavior. As we learned above it can be used for the analysis of conditions, aggregations, mapping procedure and overall process of file generation (loops, missing data etc.)


No comments:
Post a Comment