Overview
The SAP HANA Cloud management tool (HCMT) is a new addition to the database administration (DBA) tooling in SAP HANA Cloud services. Users already using the SAP HANA cockpit DBA tool will find the HCMT to be similar to the Database Directory application. The HCMT is invoked via a new option along with the SAP HANA cockpit and the SAP HANA Database Explorer (DBX) on the SAP Cloud Platform Cockpit instances page for SAP HANA Cloud.
The aim of the SAP HANA Cloud management tool is to provide DBAs with a simple and centralized overview of their SAP HANA Cloud database and data lake instances. You can also perform management tasks such as creating new instances, checking their status, reviewing any notifications and alerts that might have been raised, examining memory and storage consumption, and start//stop/edit/delete your instances.
This blog introduces you to the SAP HANA Cloud management tool and how you can use it perform the above-mentioned operations.
Launching the SAP HANA Cloud Management Tool
Once you’re logged in to SAP HANA Cloud services and assuming you already created at least one instance of an SAP HANA Cloud database, you can navigate to the SAP HANA Cloud management tool in two ways:
1. You can click on ‘Manage HANA Cloud’ button in your space page. This will take you into the HCMT page and will list all the instances you have previously created.
2. If you want to directly navigate into the HCMT of a particular instance, you can click on ‘Monitor Landscape’ option under the Actions dropdown for that specific instance. The HCMT page in this case will have only one instance listed.
Actions menu
The SAP HANA Cloud Management Tool
The following image shows how the SAP HANA Cloud management tool application looks like when you launch it using the 2nd option. I have already filtered the instances from my space and you can see my instance listed.
SAP HANA Cloud Management Tool
Next, let me walk you through other filter options based on what instances can be listed.
You can filter instances based on:
1. Status – The instances can be filtered based on their status. By clicking on the Status dropdown field, you can see various statuses of the instances like Running, Starting, Creating, Stopping, Stopped, Unknown. For example, if you want to see only the list of instances that are in status Running and Starting, you can choose both the respective checkboxes from the dropdown, and you will see only relevant instances listed.
Filter by Status
2. Alert – Instances can be filtered based on alerts. For example, if you want to see only the instances with Critical alerts and some warnings, you can select checkboxes Critical and Warning from the Alert dropdown field. This allows you to focus on instances that may be experiencing issues.
Filter by Alert
3. Type – Under the Type dropdown field, you have the option to filter the instances based on their type, either ‘SAP HANA’, ‘Data Lake’ or both by selecting relevant checkboxes.
Filter by Type
There is another way to do this as well. The instances can be filtered on the top left corner, as shown in the below screenshot.
Select Different Views
As a user, you also have an option to filter the applicable fields you would like to see on the HCMT page. For example, if you only want to see the Alert, Organization and Space fields, you can do this by clicking on the ‘Adapt Filters’ button on the right-hand side. In the pop up that is displayed, you can uncheck the Status and Type fields and click on the ‘Go’ button. Once this is done, only the fields you selected appear on top of the page.
Adapt Filters
You can further customize the user interface by selecting more columns of information to display for your instances. To facilitate this, click on the Settings icon on the right side. You can choose the columns you want to be displayed for each of the instances by selecting respective checkboxes on the pop up and clicking on ‘OK’ for the changes to be visible. The selections can be reverted back to default by clicking on the ‘Reset’ option.
Choose Columns to Display
You can see the Notifications for an instance in detail, by clicking on the icon under the Notification column.
Notifications
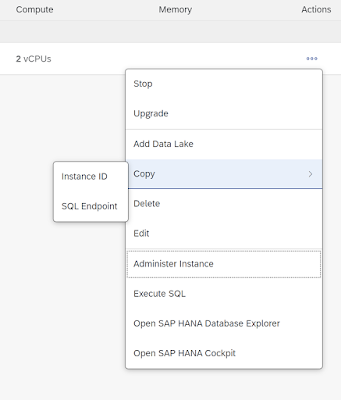
On clicking the ellipsis (…) icon in the Actions column, you can see a list of all actions that can be performed on an instance, allowing you to quickly execute popular tasks. You can Stop, Upgrade, add a Data Lake, Delete, or Edit the instance by clicking on the respective option. On clicking each of the above-mentioned actions, a new pop up window opens up where you can make any necessary changes.
Actions Available to Perform
You can directly perform other important actions like Administering the instance and Executing SQL from the list.
On clicking the Execute SQL option, the SAP HANA Database Explorer opens on a new tab with the SQL Console already loaded and you can execute the SQL statements for that specific instance. You can also choose to execute SQL queries on any of the other instances that you may intend to. For this, you will have to click on ‘Open SAP HANA Database Explorer’ option. This opens the DBX in a new tab.
Similarly, you can open the SAP HANA cockpit by either clicking on the ‘Open SAP HANA Cockpit’ option or by clicking on the ‘Administer Instance’ option. Both ways will take you to the Database Overview page of the SAP HANA cockpit for the corresponding instance.
The Copy option from the list has two other options under it. You can either choose to copy the instance ID or choose to copy the SQL endpoint. The details are copied to clipboard and can be saved for further use.

Copying the Instance ID or the SQL Endpoint
You can add new database instances by clicking on the ‘Add’ button dropdown.
Adding an Instance
When you click on the SAP HANA Cloud option, you invoke a wizard to complete with all required details to create an instance.
Create Instance Wizard


No comments:
Post a Comment