'Debugging’ is a term, which is directly associated with programming. It is a general term used by all Software Professionals, irrespective of the language and platform. ‘Debugging’, as the name suggests, is used to debug the program. IN other words it is slow motion, step by step execution of the program, so that one can closely find, how the program/ software is working.
‘Debugging is typically used to fix the Bugs in the program but in SAP debugging is invariably used for understanding the flow of program itself.
‘Debugging’ has been a vital discussion and development point across the software industry for Years. Still, there are some languages, where fixing a bug is a nightmare.
In SAP, debugging had been a quite easy task. In SAP there are various ways to debug the program, additionally one can know the values of the variable withing the execution, which is a big help to the programming professionals.
The purpose of this blog is to give overview of the various debugging techniques available in SAP. The primary focus of the document is the SAP functional consultants and ABAP learners. This document might not be fully useful for an expert ABAP consultant but can give bit of insight.
Traditional Debugging:
Debugger in SAP can be started by typing ‘/h’ in the command fields before executing the program. Normally all the Report programs has selection screen. Most of the program code gets executed after the selection screen is displayed, so the debugging can safely be started after the selection screen is displayed. If it is required to debug the portion of the code, which gets executed even before selection screen, then it is not recommended to start the debugging by this method. This method is not suitable for the Reports without selection screen. To debug SAP module pools also, this method should be used, if it is required debugging the program after first screen is displayed.
After entering ‘/h’, press enter and below message will be displayed.
Execute and debugging will start. Once the debugging starts following window is displayed.
Before going into details, it is necessary to discuss the term ‘BREAK-POINT’. Break point is a technique to stop the execution at particular line in the code and starting the debugging.
There are four different ways in which you can go through the source code of a program you want to analyze:
Execution Types in Debugging Mode:
| Single step (F5) |
Use this option to execute the program statement by statement. This allows you to branch to other program units. |
| Execute (F6) |
Use this option to process a program line by line. All of the statements on the current line are processed in a single step. This allows you to process the whole program. |
| Return (F7) |
The Debugger returns to the point at which control is passed back to the main program. Use this option to return from other program units. |
| Continue (F8) |
Use this option to process the program up to the next breakpoint. If there are no more breakpoints in the program, the system exits debugging mode and executes the rest of the program normally. |
| Watch-point |
Once can set Watch on a variable. Whenever the value of that variable changes or reaches at pre-defined value, the execution stops in debugging mode. |
The only exception to all above 5 option is the hard or soft break point. If a hard or soft break point is already set then program stop at that point, irrespective of the option selected.
The current value of the variable can be retrieved by double clicking on the variable. The value and the variable are displayed in the bottom portion of debugging window. It is possible to change the value of variable to test a particular scenario. This is controlled by the authorization. It is very dangerous to have this access in Production System. To change the value of variable, type in the new value against the variable in the window below and hit change icon displayed one per record. It is not possible to change the value of some variables like import parameter of a function etc. To view the content of internal table, go to tables tab on the Debug window and double click on the internal table. It displays the content of Internal table. If one knows the name of internal table/Variable, it can directly be written in bottom of window. On hitting enter the values are displayed.
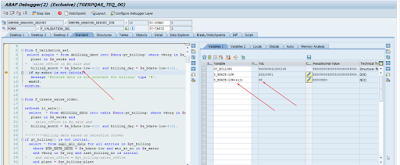
The structures or internal tables are displayed as strings as shown above GV_BILLING. If one wants to see as fields, then double click on the structure name in the above window then structure is displayed as fields as below:
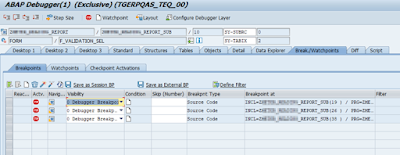
The button ‘Breakpoints’ is used to see all the breakpoints (of any type) set currently. This is useful when debugging within a loop or want to delete or deactivate a particular break point.
Programmed Break-Points:
This technique can be used in custom developments only. No SAP standard software can be debugged using this technique. In this method a command has to be embedded in the program to make the execution stop at that point. These techniques should be used if the Soft Break-Point Technique does not suffice the purpose.
There are two ways of writing the break point in the program.
1. BREAK-POINT: Use of this command will make the program execution to stop at this point.
The above technique should not be used in Field-Exits, using this command in field exits will result in the short dump. This technique should be used if program is in development stage and no one is using.
2. BREAK <UNAME>: If the program in in testing mode and is in use also, then this technique
can be used. In this technique the break point is effective for the user <UNAME> only. All other users will continue to execute the program in normal fashion. It should be noted that there are high chances that these break points are embedded in the program even after the solution and program is transported to Production System with Break Points. So special care should be taken to remove these break points.
Soft Break-Points:
The Soft Break Point is the best way of debugging, it should be preferred over all the techniques. One way is to go to the portion of the code, where break points need to be set and hit STOP Icon It sets a break point for the current User Login. The break-point will be effective in all the sessions of that particular login. The break point will be effective from the next execution of the program.
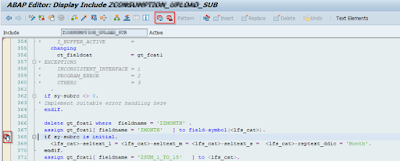
One can set soft break points in debugging window itself by double clicking command. This technique is used to fasten the debugging process. If one knows particular places, where debugger needs to stop, the break points should be set on all those places. Only limitation of this method is that the break point can be set in the current program only. If there are other include programs, then one has to wait until the control reaches to that program. These break points are applicable for that execution of the program. In next execution one has to set it again, if required to stop. It is possible to save the break point set this way. Upon saving the break points are like method 1 of this section.
SAP debugger gives an option to set the soft break point in few more ways. You can set the direct break point at:
1. ABAP/4 Statements
2. Subroutines
3. Function modules
4. System Exception
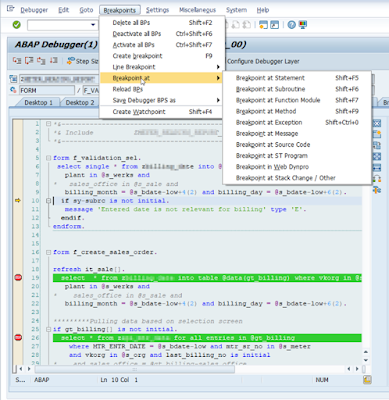
One can set break point using ABAP/4 statements like ‘SELECT’, ‘MESSAGE’, ‘CALL FUNCTION’, ‘PERFORM’, Etc. As displayed in the figure below, a small window pops up, when this option is selected. An ABAP key word has to be typed in this window. Once the enter is pressed on this popup, the soft break points are set on all the lines of all the programs, where this statement is used.
Similarly, if one wants to set a break point at particular point at particular Perform/Function module, the relevant option should be selected. A popup is displayed to enter the name of Perform/ Function module.
It should be noted that the break points set by this method are set in all the programs in the Call Stack.


No comments:
Post a Comment