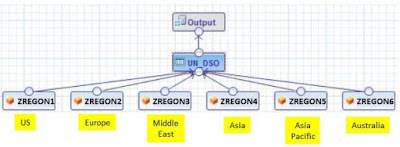
So far we have known different modeling techniques for implementing business scenarios which include data from different sources, but need to be reported together in the output. The classic example for HANA modeling workshop is to display the “Actual” and “Planned” data, which can be combined together in a Calc view using UNION operator.
The similar business case can be modeled for reporting data from different regions where data from each region can be stored in a different table as the data can be sourced from multiple sources each for a given region. In this case also, the HANA model can be based on a Calc view which is created using the UNION of Analytic views with exact same structure for each region and additional information can be supplied for identifying the region to which the data belongs to.
Fig 1. Actual vs Planned implementation using Projection nodes in UNION
Fig 2. Combining data for different regions using Analytic Views in UNION
The additional information for the Regions or Actual – Planned data can be added to the model by different methods:
- Data attribute from the source data: Adding an attribute and populating it with the Region code
- Calculated attribute in the Projection: With the “Constant Value” of ‘P’ (Planned) or ‘A’ (Actuals)
- Using new SPS05 feature of “Constant Column”
The scope of this document is to analyze the positive impacts of the new feature provided in SP05 called Constant Column. (Please refer to slide 13 in the document).
What is Constant Column
Constant column is used to denote constituent objects in the UNION node of the Calc view. Each of the included objects is identified with the column mapping as the constant values.
How does Constant Column help
Constant column helps the Query pruning in the execution when the Constant column value is used in the filter criteria of the Query.
The following Model information and Query execution plans will help understand the Query pruning using Constant Column.
- Create 4 tables (TC_R_TAB1, TC_R_TAB2, TC_R_TAB3, TC_R_TAB4) to store data for different regions. Each table contains 3 columns as follows:
C_COL1 : contains the Region code - 'US', 'EU', 'AS', 'AU'
C_COL2 : contains some text value which can also be used for filtering the data in query
C_COL3 : contains numeric value to be used as a Measure
- Create Analytic Views one for each table.
- Create two Calc views, one with Constant Column implementation and one with Source system mapping as follows;
Fig 3. Calc View with UNION mapping using Constant Column
In the Calc view with Constant Column implementation (ZGCV_TAB_UNI_WCC), the C_COL1 is mapped using the Constant values in the UNION node. Each of the constituent Analytic view is denoted with the Region code for the underlying data.
Fig 4. Calc View with UNION mapping using Source Column
In the Calc view without Constant column implementation (ZGCV_TAB_UNI_WOCC), the C_COL1 is mapped from the source data. The source data can come from the underlying tables or a Calculated Attribute in the Analytic views.
- Executing the same query against each of the Calc view and compare the Visual execution plan.
First Query:
select C_COL2, sum("C_COL3")
from "_SYS_BIC"."uniontest/ZGCV_TAB_UNI_WCC"
where C_COL1 = 'US'
group by C_COL2;
Second Query:
select C_COL2, sum("C_COL3")
from "_SYS_BIC"."uniontest/ZGCV_TAB_UNI_WOCC"
where C_COL1 = 'US'
group by C_COL2;
The execution plan for the first query on Calc view with Constant column shows that ONLY Analytic view with "US" mapping is queried.
Fig 5. Execution plan for query on Calc View with Constant column
The execution plan for the First query on Calc view with Constant column shows that ONLY Analytic view with "US" mapping is queried. Here since the mapping of US is done to the TC_R_TAB1 as shown in Fig 3. HANA performs the Query pruning and executes the search accessing ONLY one of the underlying Analytic view. This provides high level of query execution performance as other Analytic views are not queried at all. The other Analytic search shown above are related to internal calculations and summation of the Key Figure.
The execution plan for the Second query on Calc view without Constant column shows that ALL the Analytic views in the UNION are accessed. Although the search results on the Analytic views do not produce any result, no data is returned from the Analytic views.
Fig 6. Execution plan for query on Calc View without Constant column
As you can see in Fig 6. HANA queries each Analytic view and returns the data from the Analytic view which satisfies the Query data criteria. Here Query pruning does not happen and multiple processes / resources are used in the query execution. Although the searches are executed in Parallel, it has been observed that the overall execution time is higher compared to the Query on Calc view with Constant column implementation.
If the queries are executed multiple times in parallel, which is a practical scenario for any reporting application, then the difference in the average execution time is quite high in both the modeling scenarios.
On performing the tests on real life scenario with a UNION of 6 Analytic views, each containing about 200 - 400 million records, it has been observed that the query on the Calc view with Constant column is executed in 1.37 seconds on filtering the data from one table, whereas the same query was executed in 8.9 seconds on the Calc view without Constant column implementation.
The difference for multiple parallel query execution ( 5 queries in parallel) was observed to be average run time of 2.1 seconds for Calc with with Constant column as compared to average run time of 32 seconds on Calc view without Constant column.
I would like to request fellow HANA practitioners to perform similar tests using different models using Constant Column and without Constant Column and share their findings.
Source: scn.sap.com


No comments:
Post a Comment