Introduction
Smart Data Access (SDA) was first introduced with SAP HANA SP06 and it enables enterprise to dynamically access and report across heterogeneous sources like SAP HANA, Sybase IQ, Sybase ASE, Hadoop, SQL Server, Teradata, Oracle and SQL Server.
Please refer to the links below, for more details
SAP Unveils SAP HANA Service Pack 6 (SP6) for Big Data and Spatial Processing
Modelling capabilities on these remote virtual (SDA) tables were introduced with HANA SP07, however this was limited to SQL based calculation views. Graphical calculation views can also be created using the SDA tables, however in this scenario the Aggregation (read. GROUP BY) was not pushed down to the remote database.
https://drive.google.com/open?id=0B2gB-XPbh9E7bk5va1JnVlNOdEE
SDA Features Enhancements with HANA SP08 (Rev 82)
Finally SAP HANA SP08 (rev 82) introduced the capability of Aggregation (GROUP BY) push down to the remote database in down in graphical calculations. That’s truly opens the possibility of building models on top of SDA virtual tables and hence building analytic solution.
Implementing a fully functional SDA Solution
In this article, I'm going to show you how to take advantage of this new feature.
Step 1: Creating the Remote Data Source
SQL Syntax:
CREATE REMOTE SOURCE <Connection-Name> ADAPTER "iqodbc" CONFIGURATION
'Driver=libdbodbc16_r.so;
ServerName=<IQ-Server>;
CommLinks=tcpip(host=<IQ-Server>:<IQ-DBPort>);
DatabaseName=<IQ-DBName>'
WITH CREDENTIAL TYPE 'PASSWORD'
USING 'user=<IQ-DBUser>;password=<IQ-DBUserPasswd>';
Example:
CREATE REMOTE SOURCE <Connection-Name> ADAPTER "iqodbc" CONFIGURATION
'Driver=libdbodbc16_r.so;
ServerName=SAPNLS_SERVER_SP08;
CommLinks=tcpip(host=<IQ-Server>:16050);'
WITH CREDENTIAL TYPE 'PASSWORD'
USING 'user=NLSUSER;password=xxxxxx';
Note: This need to be done only once for each remote database.
Step 2: Creating Virtual Table
SQL Syntax:
CREATE VIRTUAL TABLE
<Table_Name> AT
<IQ-Connection>.<IQ-DBName>.<IQ-User>.<IQ-Table_Name>;
Example:
create virtual table "SAPNLSDB"."/BI0/TREGION"
at "SAPNLSDB"."<NULL>"."NLSUSER"."/BI0/TREGION";
Note: This should be repeated for each remote tables, you need for your models.
Step 3: Create a Graphical Calculation View
The process is exactly same as native HANA tables.
In this example (See the picture in Step 4):
- I'm using Star-Join in the calculation view
- I've created the calculation views for master data (CA_COUNTRY & CA_REGION)
Step 4: Settings to execute in SQL Engine
All the calculation views using SDA-based virtual tables should be set to Execute In: SQL Engine
Step 5: Test & Confirm
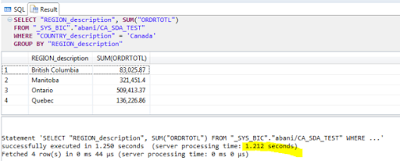
In this example, the join of the Fact table to the participating master data table and the WHERE clause “COUNTRY_description” = ‘Canada’ will be pushed down to the remote database (i.e Sybase IQ)
You can also use the SDA Cockpit to find out the exact query executed in the remote database.
Step 6: Visualization:
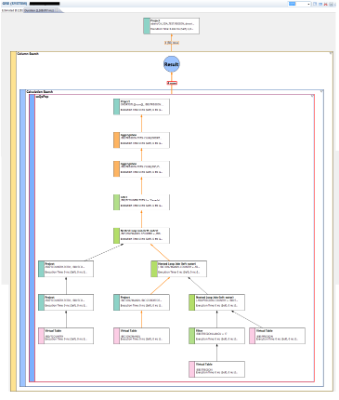
You can also use the HANA Visualization to find out more details
Source: scn.sap.com


No comments:
Post a Comment