In the article SAP HANA Modeling Introduction and SAP HANA Calculation View we explained the basics of SAP HANA data modeling.
Calculation view can be defined as either graphical views or scripted views. In this article we will learn how we can create graphical calculation view.
Prerequisite:
You have SAP HANA Studio installed on your machine.
You have added an SAP HANA system in HANA Studio
Scenario:
Suppose there are 3 tables PRODUCTS, REGION and SALES.

We need to find out
- What are the sales value for "Asia" region?
- What are the total sales value for "Shirts"?
- What are the total sales value for "Europe" for "Jackets"?
Let us create a graphical calculation view to get answer of the above mentioned questions.
Create new tables in SAP HANA and fill them with data:
1. Open HANA Studio and expand the SAP HANA system.
2. Go to your schema. Right-click on your schema and select SQL editor.

Note: In this example schema name is "SAP_HANA_TUTORIAL". In case you want to create a new schema use below query.
create schema <schema_name>;
3. Copy and paste the below script in SQL editor and execute.
----REPLACE <YOUR SCHEMA> WITH YOUR SCHEMA NAME
---- Create Product table
create column table "<YOUR SCHEMA>"."PRODUCT"(
"PRODUCT_ID" INTEGER,
"PRODUCT_NAME" VARCHAR (100),
primary key ("PRODUCT_ID")
);
insert into "<YOUR SCHEMA>"."PRODUCT" values(1,'Shirts');
insert into "<YOUR SCHEMA>"."PRODUCT" values(2,'Jackets');
insert into "<YOUR SCHEMA>"."PRODUCT" values(3,'Trousers');
insert into "<YOUR SCHEMA>"."PRODUCT" values(4,'Coats');
insert into "<YOUR SCHEMA>"."PRODUCT" values(5,'Purse');
-- Create Region table
create column table "<YOUR SCHEMA>"."REGION"(
"REGION_ID" INTEGER,
"REGION_NAME" VARCHAR (100),
"SUB_REGION_NAME" VARCHAR (100),
PRIMARY KEY ("REGION_ID")
);
insert into "<YOUR SCHEMA>"."REGION" values(100,'Americas','North-America');
insert into "<YOUR SCHEMA>"."REGION" values(200,'Americas','South-America');
insert into "<YOUR SCHEMA>"."REGION" values(300,'Asia','India');
insert into "<YOUR SCHEMA>"."REGION" values(400,'Asia','Japan');
insert into "<YOUR SCHEMA>"."REGION" values(500,'Europe','Germany');
-- Create Sales table
create column table "<YOUR SCHEMA>"."SALES"(
"REGION_ID" INTEGER ,
"PRODUCT_ID" INTEGER ,
"SALES_AMOUNT" DOUBLE, PRIMARY KEY ("REGION_ID", "PRODUCT_ID") );
insert into "<YOUR SCHEMA>"."SALES" values(100,1,100);
insert into "<YOUR SCHEMA>"."SALES" values(100,2,90);
insert into "<YOUR SCHEMA>"."SALES" values(100,5,85);
insert into "<YOUR SCHEMA>"."SALES" values(200,2,80);
insert into "<YOUR SCHEMA>"."SALES" values(200,1,75);
insert into "<YOUR SCHEMA>"."SALES" values(300,3,85);
insert into "<YOUR SCHEMA>"."SALES" values(400,4,75);
insert into "<YOUR SCHEMA>"."SALES" values(500,1,65);
insert into "<YOUR SCHEMA>"."SALES" values(500,2,65);
4. After executing the scripts you should have 3 tables created. If there are no tables, try right-clicking on your schema and refreshing.

Grant schema SELECT rights to _SYS_REPO user:
Open the SQL editor of your schema and execute the following command line:
GRANT SELECT ON SCHEMA <YOUR SCHEMA> TO _SYS_REPO WITH GRANT OPTION;
If you miss this step, an error will occur when you activate your views later.
Steps for creating calculation view:
1. Open HANA Studio and make sure you are in Modeler perspective. Right click on the package and choose "Calculation View"
2. Enter a name and a description. Select Subtype as "Graphical" and Data Category as "Cube". Then click on "Finish".

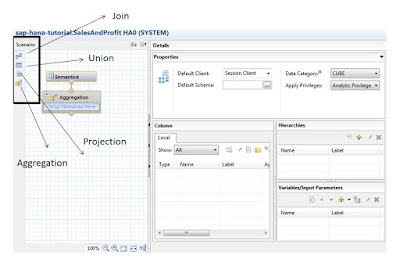
3. You will see the graphical editor as shown in image below.
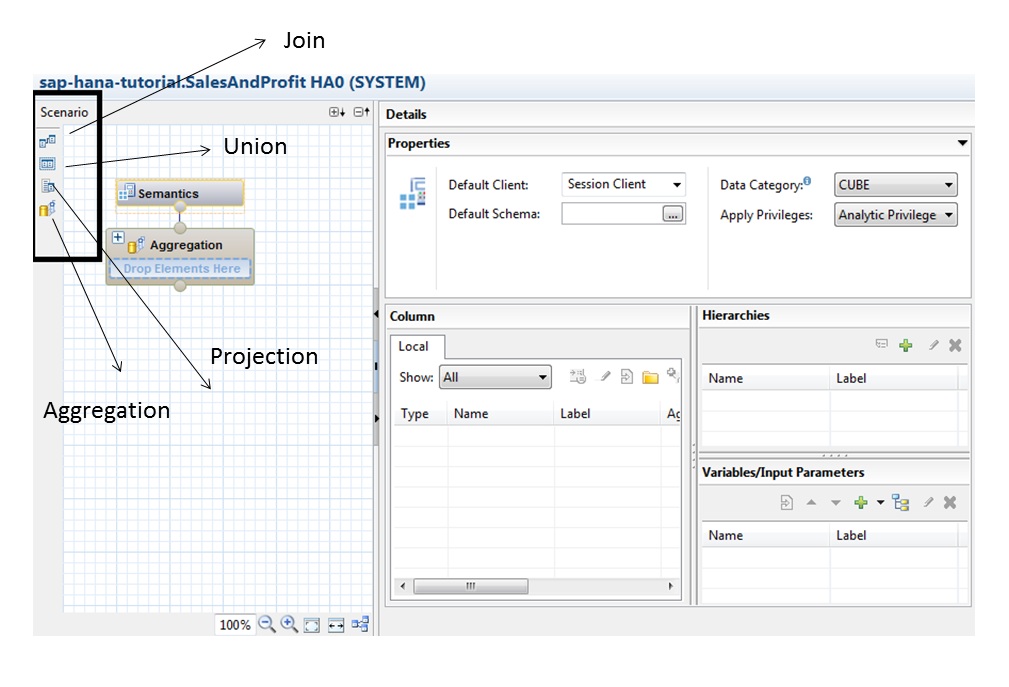
4. Click on the "Join" symbol and drag it in the scenario area to create Join block. Click on "+" sign of "Join" and add REGION tables.

5. Similarly add SALES table.
6. Select the REGION_ID from REGION table. Drag it and drop it on the REGION_ID of SALES table. Join type can be changed in the Properties tab. Let it be Inner Join as of now.

7. Add REGION_NAME, SUB_REGION_NAME, PRODUCT_ID AND SALES_AMOUNT to the Columns by right clicking and clicking on "Add To Output". Alternatively you can also click on the grey color circle before the column name to add it to output.

8. Click on the "Join" symbol again and drag it in the scenario area to create another Join block. Connect the previous Join block to new Join block with the arrow.

9. Click on "+" sign of new Join block and add PRODUCT table.

10. Select the PRODUCT_ID from Join_1. Drag it and drop it on the PRODUCT_ID of PRODUCT table. Select the Join type as Inner Join.
Add REGION_NAME, SUB_REGION_NAME, PRODUCT_ID, SALES_AMOUNT and PRODUCT_NAME to the Columns by right clicking and clicking on "Add To Output".

11. Add the Join block "Join_2" to "Aggregation" block by arrow. Add all the columns to output.
12. Select Semantics. Now we need to specify which columns are attributes and which columns are measures. Click on the "Auto Assign" button to do it automatically.
Alternatively you can also specify the Attribute/measure by clicking on Type down-arrow. Select SALES_AMOUNT as measure and rest of the column as attribute.

13. Activate the calculation view. Right-click on your calculation view and choose "Data Preview". After that, you can browse through the tabs named Raw Data, Distinct Values, and Analysis.
Analysis tab:

Raw Data tab:

Congratulation!! You have successfully created your first Graphical Calculation View.
Continue reading:
- Build Reports in Excel using SAP HANA Data
- SAP HANA Analytic Privilege
- SAP HANA Join Types - All You Ever Wanted to Know
No comments:
Post a Comment